Psychrometric Chart
Psychrometric Chart
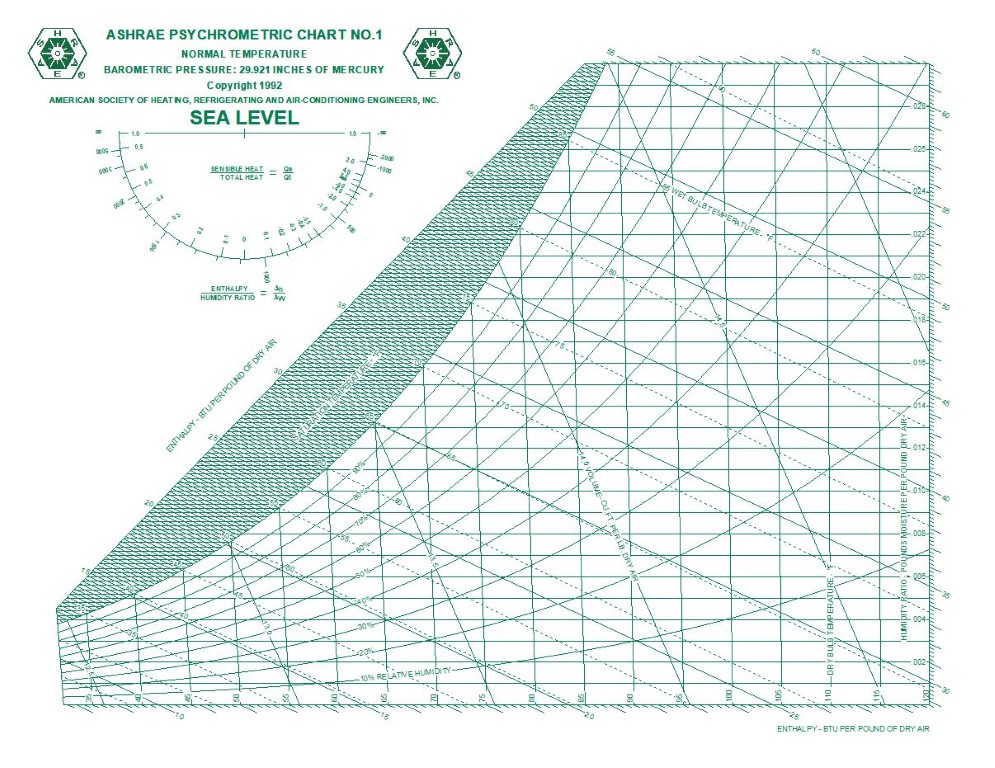
Although engineers and technicians need to know how the values of such properties of air as specific humidity, sensible and latent heat, and relative humidity in our designs, the actual computation of these quantities is much too burdensome for everyday operations. Even the use of prepared tables of values is time consuming, since interpolation is often required. Air conditioning is not an exact science, and information that is sufficiently precise for the solution of most air conditioning problems can usually be obtained from graphs or charts. Many such charts are used in engineering practice. The one that concerns us here relates temperature, humidity, enthalpy, and certain other properties of moist air is called the Psychrometric chart.
The psychometric chart is probably the most valuable single tool available to the air conditioning engineer or design technician. With it, the preliminary specifications for an entire system may be laid out. Guidelines for equipment performance can be decided upon, and the limits of any necessary compromises can easily be determined and explained to the customer. Every engineer, technician, and contractor in the industry should become thoroughly familiar with the psychrometric chart and use it in daily practice.
Understanding the Psychrometric Chart
The best way to understand the psychometric chart is to observe how such a chart is plotted. A brief description of the essential lines on the chart and how they are plotted will be given. Psychometric charts from different sources are not exactly alike, but all of them attempt to show the relationships among dry-bulb temperature, wet-bulb temperature, dew-point temperature, relative humidity, total heat (enthalpy), specific volume, specific humidity, and sensible heat. The several manufacturers of air conditioning equipment provide psychrometric charts in a range of sizes, up to large wall charts for office use, psychrometric charting softwares are also available.
Saturation Line
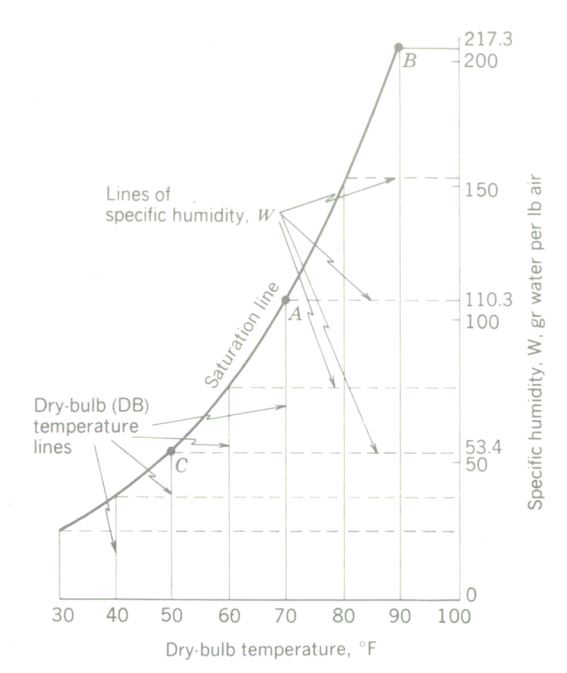
First the dry-bulb temperature scale is plotted along a horizontal axis, and the specific-humidity scale along a vertical axis, as shown. Data for plotting are obtained from tables of the properties of moist air. The saturation line is the locus of all points representing a saturated air water vapor mixture. To determine the location of a point on the saturation line, all that is necessary is to determine the value of Wsat, the specific humidity at saturation, for a given dry bulb temperature. For example, at 70°F db, the specific humidity at saturation is 110.3 gr per pound of dry air. This condition is plotted as point A on the diagram. At 90°F DB Wsat = 217.3 gr/lb (point B); at 50°F DB it is 53.4 gr/lb (point C); and so on. After a sufficient number of points have been plotted, a smooth curve is drawn through them. This is the saturation line. Any point on this line represents a condition at which air has all the water vapor it can hold at that DB temperature.
Plotting Lines of Constant Relative Humidity
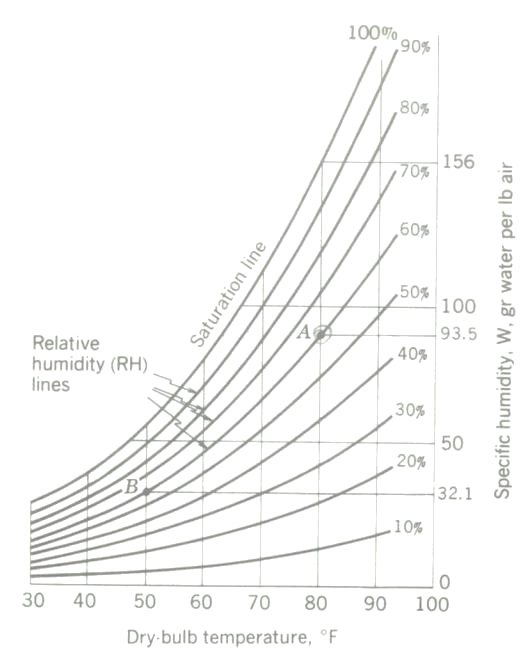
Lines of constant relative humidity can be superimposed on to the same chart. For example, say the 60 percent RH line. First, locate the point of 60 percent RH on the 80°F DB line, as follows. Since at 80°F is 156 gr/lb, the moisture content at 60 percent RH = 0.60 X 156 = 93.5 gr per pound of dry air. This condition is plotted as point A. To locate another point note that at 50°F DB a 60 percent RH results in W = 0.60 X 53.4 = 32.1 gr/lb. Point B on the 60 percent RH line is thus located. After a sufficient number of points have been plotted, a smooth curve is drawn through them, which is the 60 percent relative-humidity line. The other relative-humidity lines are plotted in the same manner. Note that, with the saturation line (100 percent RH), these lines constitute a family of curves sloping generally upward and to the right.
Lines of Constant Wet-Bulb Temperature
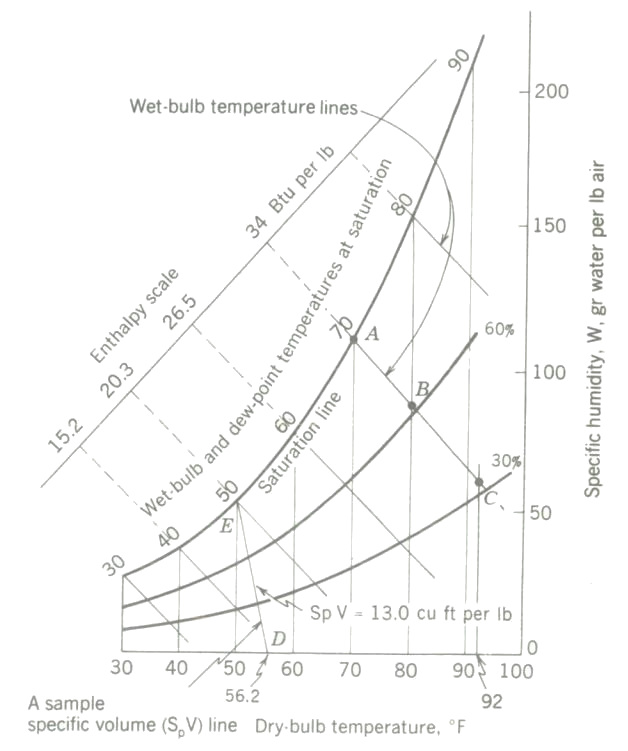
To locate lines of constant wet-bulb temperature, at saturation, dry-bulb temperature = dew point temperature = wet bulb temperature, one point on each wet bulb line is already located, that is, the point of intersection of each dry-bulb line with the saturation line. Consider, for example, point A, which represents saturated air at 70°F (DB = WB = DP). Now determine another point on the 70°F wet bulb line, for example, the point where it intersects the 80°F DB line. To locate this point refer to property of moist air and noted that at 80°F dry bulb a 10°F (80 – 70) wet-bulb depression gives an RH of 61%. The point B is plotted on the 80°F dry bulb line at the point of intersection with the 61% RH line. Another point on the 70°F wet bulb line may be determined in a similar way. At 92°F dry bulb, a 22°F (92 – 70) wet bulb depression gives a relative humidity of 33%. This point is labeled C, and it is noted that points A, B, and C lie on a straight line ie the 70°F wet bulb line. Other wet-bulb lines can be plotted similarly.
Plotting the Enthalpy Scale
The total heat content of air-water vapor mixtures (enthalpy) is a function of wet-bulb temperature. In other words, as long as the wet-bulb temperature of an air sample remains constant, its total heat does not change. Enthalpy values are plotted on wet-bulb lines extended slightly to the left of the saturation line to make for easier reading.
Enthalpy equals sensible heat of the air plus sensible heat of the liquid plus latent heat of the vapor plus superheat of the vapour.
Plotting Lines of Specific Volume (SpV)
The specific volume (SpV) of dry air and of saturated air can be obtained from Properties of Mixtures of Air and Saturated Water Vapor.
The Psychrometric Chart-Definitions
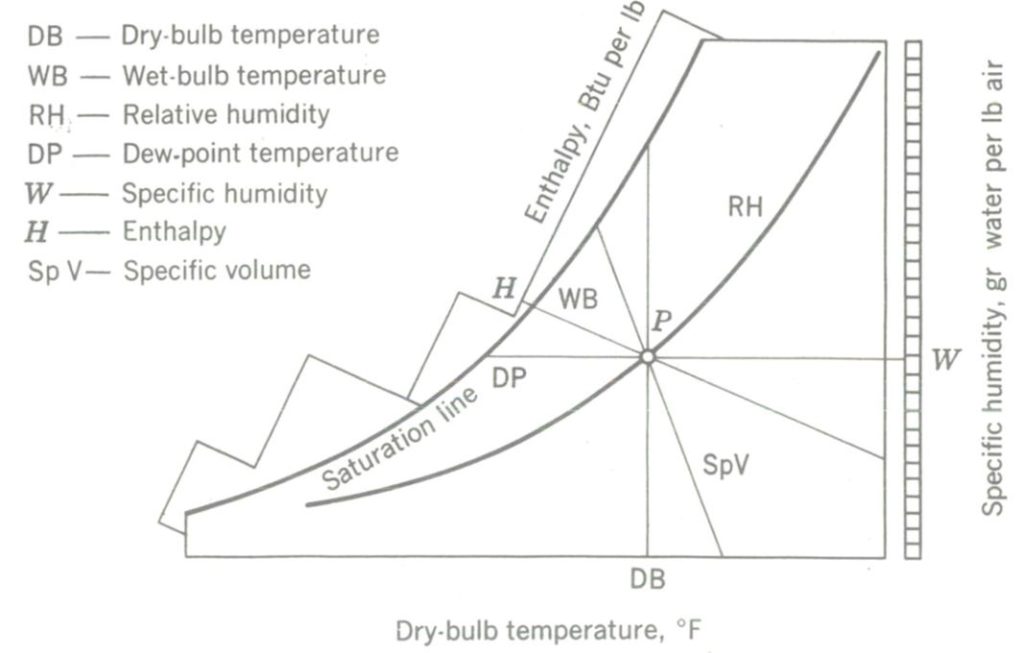
Dry-bulb temperature (DB) is the temperature of air as read on an ordinary thermometer. Dry-bulb temperatures are plotted as vertical lines originating from the dry-bulb axis on the bottom of the chart. Dry bulb temperature is a measure of sensible heat, and a change in dry bulb temperature represents a sensible heat change.
Wet-bulb temperature (WB) is the temperature of the air as read from a thermometer whose bulb is covered by a wet wick and whirled in the air. Wet-bulb temperatures are plotted as lines which originate on the saturation line and slope downward to the right. Wet-bulb temperature is an indicator of total heat (enthalpy), that is sensible heat plus latent heat.
Dew-point temperature (DP) is the temperature of air at saturation, or the temperature to which air must be cooled before condensation of its moisture will begin. Dew-point temperatures are marked as points along the saturation line. At saturation, dew point = wet bulb = dry bulb. Dew-point temperature is a measure of latent heat, and a change in dew-point temperature represents a latent-heat (moisture-content) change.
Specific humidity (W) is the actual moisture content of air in grains of water vapor per kilogram of dry air. Some charts also give values of W in kg of water vapor per kg of air. The W scale is on the right hand vertical boundary of the chart.
Relative-humidity (RH) is the ratio of the actual water vapor pressure in the air to the pressure of saturated vapor in air at the same temperature. With only slight error it can be said that relative humidity equals the percent saturation of the air, or the ratio of the actual specific humidity W to the specific humidity at saturation, Wsat, that is, RH ~ W/Wsat. Relative-humidity lines begin at the lower left and curve upward to the right with approximately the curvature of the saturation (100 percent RH) line.
Specific volume (SpV) is the reciprocal of density and is expressed in cubic feet of air-water vapor mixture per pound of dry air. Lines of specific volume originate along the DB axis and slope sharply upward to the left.
Enthalpy, or total heat content (H), is a quantity indicating the heat content of the air-water vapor mixture above arbitrary zero points (0°F for dry air and 32°F for the water content). It is expressed in Btu per pound of dry air. Enthalpy values are found along the scale above the saturation line at the left of the chart.
Reading the Psychrometric Chart
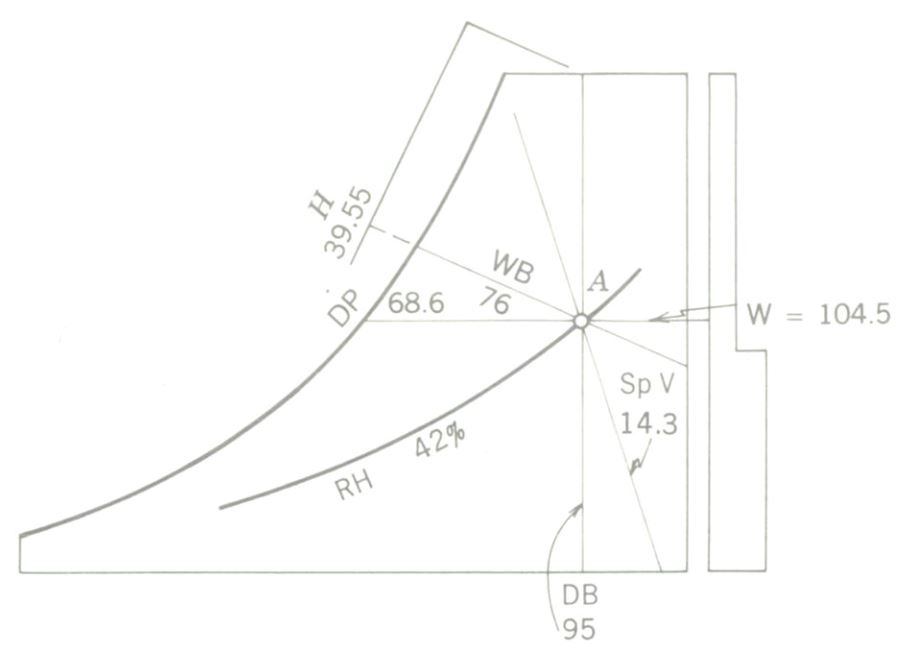
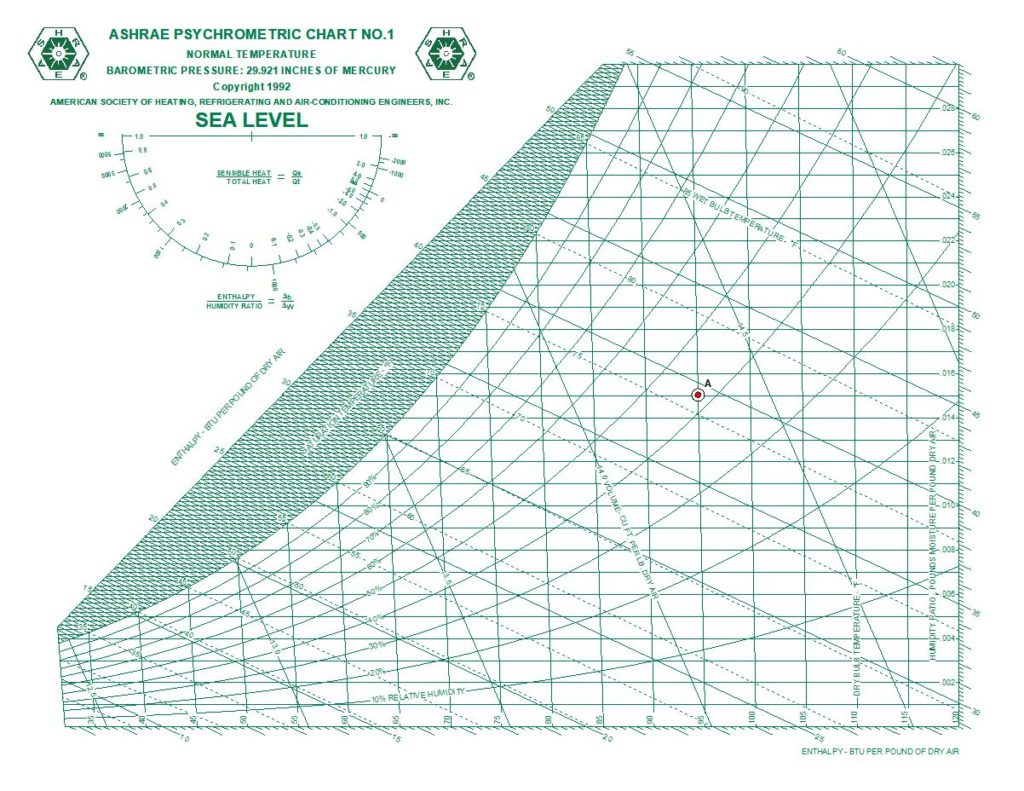
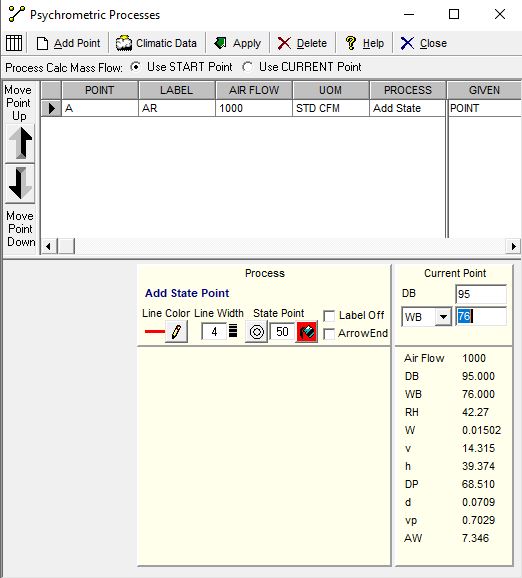
Suppose a sling psychrometer gives the following readings, DB = 95°F, WB = 76°F. To Find the other five psychrometric properties of this air, refer to psychrometric chart below, where the given condition is plotted as state point A. Now refer to the psychrometric chart itself and interpolating the RH as 42%. Following a horizontal line right to the specific-humidity scale gives W = 104.5 gr of water vapor per pound of dry air. Following the same line left to the saturation line gives DP = 68.6°F. Interpolating between the SpV lines of 14.0 and 14.5 gives an approximate SpV of 14.3 ft3/lb. The enthalpy is found by following the WB line leftward and up to the saturation line and beyond to the enthalpy scale. For the condition given, H = 39.55 Btu/lb of dry air.
Using the ASHRAE psychrometric charting software, the state point and properties can be easily identified.
Changing the Condition of Air
The heating, cooling, humidifying, and dehumidifying processes which take place in air conditioning all change the air from a condition represented by an initial state point on the chart to some condition represented by another state point on the chart. There are six different processes possible:
- Constant-sensible-heat process (indicated by constant dry-bulb temperature)
- Constant-latent-heat process (indicated by constant-moisture content and constant dew-point temperature)
- Constant-enthalpy (total-heat) process or adiabatic process (indicated by constant wet-bulb temperature)
- Constant-relative-humidity process (all other factors change)
- A change representing a combination of the above, not falling along any of the constant process lines
- Mixture of air quantities at different conditions
It should note again that:
- Dry-bulb lines are lines of constant sensible heat.
- Dew-point lines are lines of constant latent heat.
- Wet-bulb lines are lines of constant total heat (enthalpy).
It is necessary to remember that the psychrometric charts are not instruments of great precision and also that even with the same chart, all persons do not necessarily get identical results.
Heating Air without Adding Moisture
This is a constant-latent-heat or constant-moisture process, and the dew-point temperature remains constant. Only sensible heat is added to the air. This is the process involved in forced-air heating systems using furnaces not equipped with humidifiers and in hot-water or steam heating with radiators made up of finned coils. Such processes are commonly termed sensible-heating processes and are represented by horizontal lines on the psychometric chart, since specific humidity remains unchanged.
Healing with Humidification
Good winter air conditioning practice provides humidification during the heating process. Sufficient moisture is usually added to try to maintain a relative humidity of 20 to 40 percent in the conditioned space.
Cooling with Constant Enthalpy - Adiabatic Cooling
This process occurs along a constant wet-bulb line. Air washers for ventilating systems and evaporative coolers for residences and business establishments make use of this process. Since total heat is constant, sensible cooling (drop in DB temperature) can occur only if latent heat (that is, moisture content) increases. Sensible heat in the air is used up in evaporating more moisture, the DB temperature falls, the WB temperature remains constant, and the specific humidity and relative humidity both rise.
Cooling with Constant - Moisture Content - No Dehumidification
This process is the reverse of heating with constant moisture content. The process can be illustrated on the psychrometric chart by moving left horizontally. Only sensible heat is removed from the air as long as the air dew point is not reached. Evaporative cooling cannot accomplish dehumidification, refrigeration is required.
Such a sensible cooling process requires that the cooling equipment operate at a temperature that is above the dew-point temperature. If the air is cooled below the dew point, moisture will be condensed from the air. A refrigeration cooling coil cools air by this process until the dew point of the air is reached.
Cooling with Dehumidification
The usual summer cooling or refrigerated air conditioning is an example of this process. Theoretically, the air-water vapor mixture is first cooled (sensible heat removed) along a constant-moisture line until the saturation line is reached. Further heat removal results in condensation of the water vapor, and moisture is thus extracted from the air at the same time as the dry-bulb temperature is being further reduced, and the process moves down the saturation line in its second phase. The cooling can be accomplished by passing the air through finned coils containing either chilled water or a direct-expansion refrigerant or by pulling the air through a water spray whose temperature is well below the dew-point temperature of the air to be conditioned.
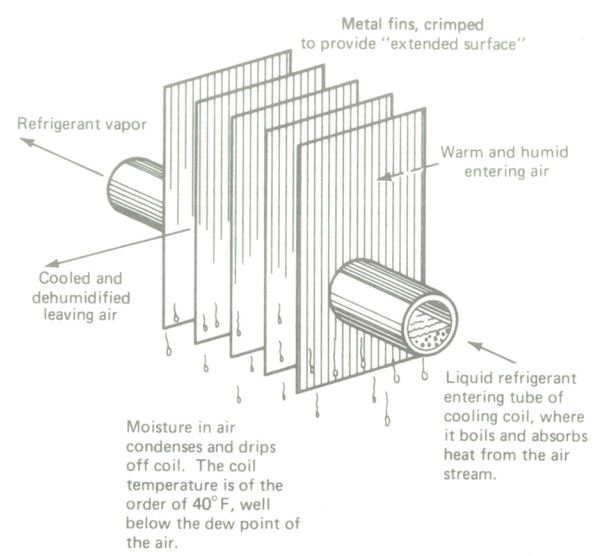
Mixtures of Air Quantities
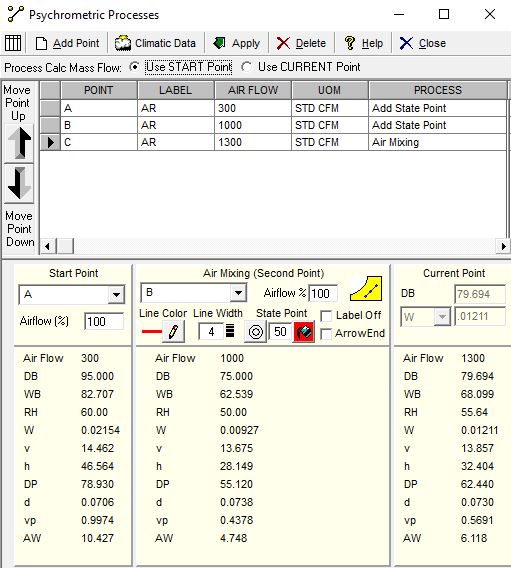
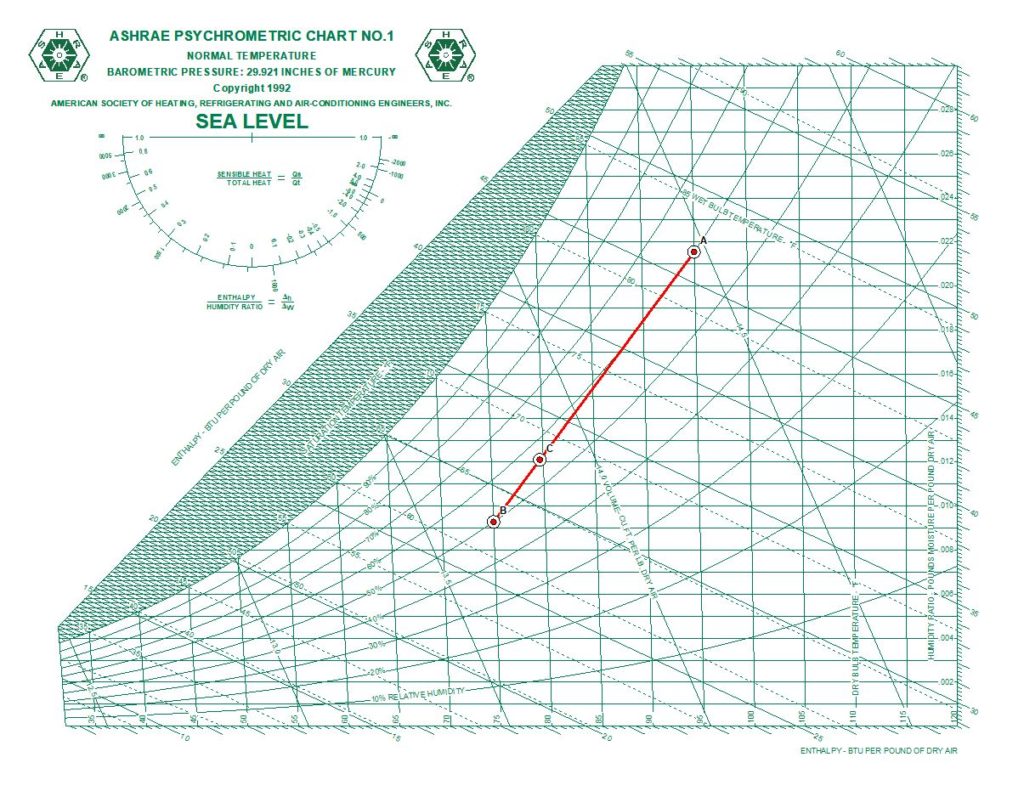
The process of mixing two air streams occurs in air conditioning systems, and it is necessary to determine the properties of the resultant mixture. An example would be mixing outside air with space or return air. For all practical purposes, the mixture process line may be represented on the psychometric chart as a straight line connecting the points indicating the states of the two air quantities, with the mixture point lying somewhere on this process line.
Assume A to be the state point of a flow of outside air which is to be mixed with a flow of return air whose condition is represented by state point B. The mixture will be at some state point C along the AB process line. Applying the law of conservation of energy and the law of conservation of mass to the mixing process, point C can be identified or you may simply use the ASHRAE Psychrometric Software.
Apparatus Dew Point
All the air that passes through a coil does not necessarily come in contact with the coil surface. As a consequence, air-off the coil temperatures are not as low as the actual apparatus or coil-surface temperature. This performance of a finned coil may be easily explained by an air mixing example. Using the information air at 95°F DB, 60 percent RH, being cooled to 55°F, saturated, consider the following analysis.
Air which comes in direct contact with the finned surface will leave the coil at or near the average coil surface temperature, in this case 55°F DB. Some of the air does not come in contact with the cold coil surface, however, and is “bypassed” through the coil. It is neither cooled nor dehumidified and leaves unchanged at 95°F DB, 60 percent RH. And some air, of course, leaves at intermediate conditions. The air streams mix together after leaving the coil to produce a leaving condition on the line AC, such as point E. The location of point E, the actual coil-leaving condition, depends on the type of coil, air velocity, and construction. The more rows of tubes and the more extended surface area a cooling coil has, the closer point E can be to the coil surface temperature.
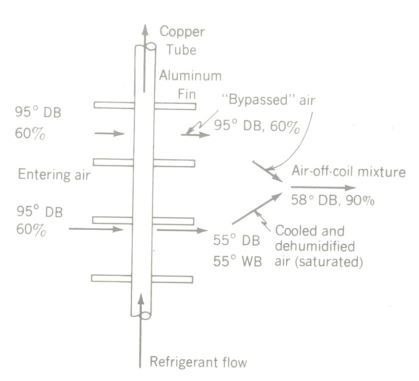
Cooling and dehumidifying air as it passes through a finned tube cooling coil. The leaving air is actually a mixture of cooled and dehumidified air and bypassed air. Fins are much more closely spaced than the diagram indicate, and they are crimped to provide better air to metal contact.
We speak, therefore, of two dew points: the air dew Point and the apparatus dew Point. Coil surfaces must be kept colder than the expected air-off coil temperature. Stated in a different manner, apparatus dew point will be lower than air dew point. How much lower depends on the efficiency of the cooling coil or spray. Four-row finned coils may contact about 80 percent of the air which passes through them, six-row coils, 92 percent, and well-designed spray chambers, 96 to 98 percent.
Apparatus dew Point for a cooling coil may be practically defined as the average temperature of the coil surface. For a well-designed chilled-water spray dehumidifier, apparatus dew point is very nearly equal to the dew point of the leaving spray chamber.
Sensible Heat Factor
Let’s suppose a certain design condition is to be maintained in a conditioned space, say 80°F DB and 50 percent RH. Heat leakage and moisture leakage into the space must be removed by the conditioned air supplied to the space. In order to remove sensible heat, the supply air must be cooler than the room design temperature, and in order to remove moisture, the supply air must have a lower dew point than the dew point of the room design condition. Actually, air at a number of different combinations of dry-bulb, wet-bulb, and air-flow quantity may be supplied to a space and maintain the design condition specified. If all such possible conditions were calculated, their state points would plot on a psychrometric chart to a straight line originating at the room design condition and crossing the saturation line at the apparatus dew point. The slope of this condition line can be easily determined from the chart.
Heat to be removed from a room or space by conditioned air is made up of room (space) sensible heat and room latent heat. In order to maintain the design condition. It is not enough merely to remove the same total heat per hour as the room gains in that time. The proper proportions of sensible heat and, latent heat must be removed, and herein lies the importance of apparatus dew point and the condition line which connects it to the state point representing the room design condition.
The ratio of room sensible heat to room total heat is called sensible-heat factor (SHF) and it can be written as
SHF = HS/(HS + HL)
where
HS = sensible-heat gain per hour
HL = latent-heat gain per hour
By actual observations under controlled conditions it can be shown that the sensible heat factor for a room represents the same mathematical slope as the condition line connecting apparatus dew point to room design state point.
In designing an air conditioning system, determining air quantities, and selecting refrigeration equipment and cooling coils, the proper apparatus dew point is essential. The practicing air conditioning engineer determines the proper apparatus dew point from the sensible heat factor and the psychrometric chart in the following manner.
The room design condition is first decided upon, and the room sensible and latent loads in Btu per hour are calculated. The sensible-heat factor (SHF) is then calculated from the sensible heat factor formula.
Note the SHF scale at far right of the psychrornetric chart. Its base reference point (SHF = 1.00) is 80°F DB and 50 percent RH, a more or less standard design condition for comfort cooling. Draw a line on the psychrometric chart connecting the computed SHF with the reference point (80°F DB, 50 percent RH). This line is called the reference line. Then draw a second line with the same slope (that is, parallel to the reference line) through the designed room condition until it intersects the saturation line. This second line is called the room condition line or room SHF line. The point of intersection of this line with the saturation line determines the required apparatus dew point.
To maintain the space conditions specified by the design and remove the proper proportions of sensible and latent heat, the supply air to the space must be at a condition represented by a specific point on the room condition line.
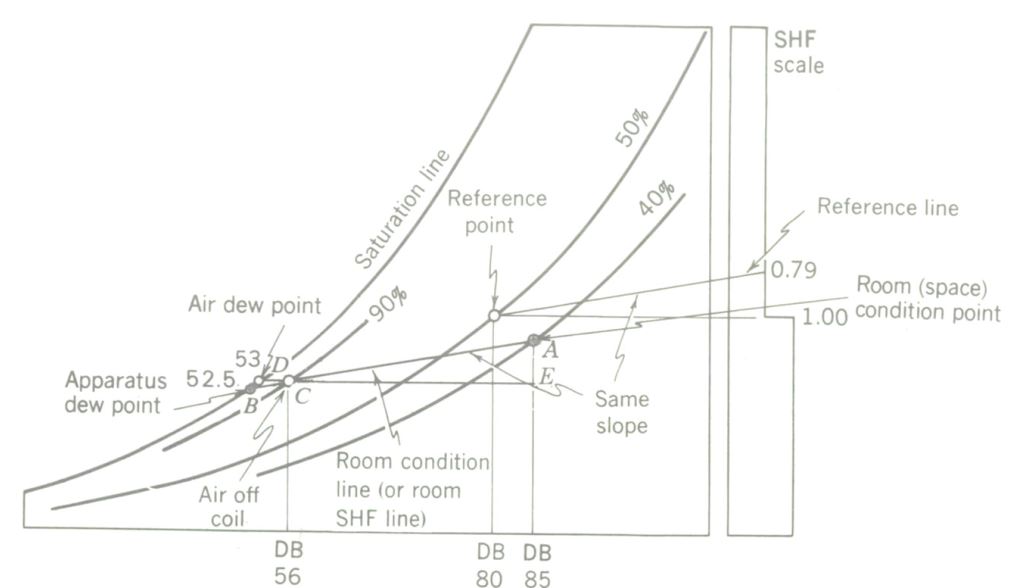
Determination of room condition line, apparatus dew point, air dew point, and air-off coil temperatures from psychrometric chart analysis
Several methods exist for determining the condition of the air supplied to the space or the air condition leaving a cooling coil. Some of these methods refer to actual equipment performance or efficiency. Two methods, which are based upon average equipment performance and are widely used, are described below.
- An average cooling coil of four to six rows will produce an air-leaving condition of approximately 90 percent RH. The intersection of the room condition line and the 90 percent RH line will provide coil leaving or supply air conditions satisfactory for many air conditioning problems.
- In order to remove the sensible heat load of the space, the conditioned air supply must be at a dry-bulb temperature lower than the space. However, excessively low supply air temperatures create cold drafts in the space, while supply air temperatures much above 60°F require excessive air flow rates. Experience and practice indicate that a temperature difference between supply air and space air of 20 to 25K will provide satisfactory performance and reasonable economy. By subtracting 20K from the specified space DB temperature, the desired dry-bulb temperature of the supply air may be approximated. The intersection of this dry bulb line with the room condition line (also called the room SHF line) locates the conditioned air supply point.
It is well to realise that both of these methods involve assumptions and approximations and are used only for comfort cooling where design standards are not rigorous. They are not applicable to complex problems of air conditioning design.
Solution of Practical Problems with the Psychrometric Chart
Most practical air conditioning systems or cycles utilise these psychrometric processes, singularly or in combination, to maintain control of specific space conditions. Before examining applied psychrometric problems, it is desirable to review the operating principles of an air
conditioning system.
During the summer months, both sensible heat and latent heat (moisture) are transferred into the space or generated within the space. The summation of all the heat quantities (both sensible and latent) entering or produced in a space is termed the air conditioning load. In order to maintain the desired space conditions of temperature and humidity, the conditioned air must remove sensible and latent heat at the some rate and proportion as they enter or are produced in the space.
This heat removal is accomplished by introducing the conditioned air supply at a dry bulb temperature and specific humidity below those of the space condition. As the supply air warms to space conditions, it picks up sensible heat, and as it mixes with room air and warms up, it takes on moisture (latent heat). The process line from the supply-air condition to the space-air condition is represented by the sensible heat factor (SHF) line between the air-off coil condition point and the space condition point.
During winter heating periods, air is introduced at a temperature above the space condition and the supply air must add heat equal to the space heat loss as it cools to space conditions. Moisture can be added to the supply air by a suitable humidifier.
Based upon these operational principles, the essential purpose of the air conditioning equipment is to supply the proper quantity of air at the condition necessary to set the space heat gain or loss (sensible and latent) and in this manner maintain design conditions in the space.
Most air conditioning problems require the following steps in their solution:
- A survey of the entire design to obtain accurate and detailed information needed to estimate the load and specify the equipment
- A load estimate to determine the sensible and latent heat to be removed from the space
- Psychrometric analysis to determine and specify equipment performance and airflow requirements
- Selection of equipment from calculated information
- Layout, preparation of drawings, and specifications for the system
- Installation, operation, and testing of the system
The calculation of air flow requirements is directly related to the psychometric principles:
- The room SHF line (or room condition line) represents the process line required to satisfy the sensible and latent loads of a space.
- The final equipment-leaving condition or supply air condition must lie on the room SHF line to satisfy the space conditions.
- The process line of the air from the instant it enters the space is the room SHF line between supply-air point and space condition point.
- After the equipment leaving or supply air conditions are specified or assumed, the process line may be described by a right triangle whose horizontal base determines the sensible heat change, whose vertical height determines the latent-heat change, and whose hypotenuse is the SHF line.
Related
Read more: Fan wall
Read more: How to verify the percentage of outside air in an enclosure
Read more: BCA Part J5 Air-conditioning system control
Read more: Microbial Induced Corrosion (MIC) in Pipes
Read more: Is your kitchen exhaust system a fire hazard
Read more: What is coanda effect
